
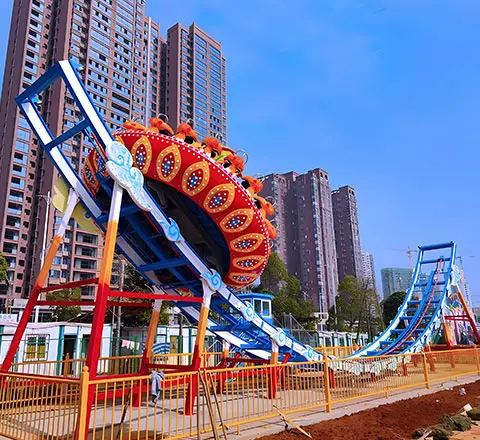


A pendulum ride may recover its investment in around six months under unusually favorable conditions, while other projects may take several years or longer. Some may never reach full payback. The result depends primarily on the type and size of the ride, total installed cost, actual visitor demand, ticket model, operating season, equipment availability and recurring expenses.
There is therefore no universal pendulum ride payback period. A reliable estimate should use the complete cost of placing the attraction into operation and the cash it can realistically generate after operating expenses.
The basic formula is:
Payback Period = Total Installed Project Cost ÷ Average Monthly Operating Cash Contribution
This guide explains how amusement park owners, scenic attraction investors and carnival operators can calculate pendulum ride revenue, operating costs and potential return without relying on unsupported income promises.
Reviewed by: Carnee Rides Project Planning and Engineering Team
Last updated: September 2026
Methodology note: This guide uses a simple cash-payback model for preliminary project planning. All examples are hypothetical. Final calculations must use model-specific specifications, a confirmed quotation and local operating data.

What Is a Realistic Pendulum Ride Payback Range?
The following ranges provide a broad planning expectation rather than a guaranteed result.
| Possible outcome | Conditions that may produce it |
| Around 6–12 months | Strong visitor demand, separately paid tickets, suitable equipment cost, high occupancy, long operating season and limited downtime |
| Around 1–3 years | Stable but seasonal demand, moderate occupancy, normal maintenance requirements and controlled operating expenses |
| Several years or longer | High total investment, short operating season, weak demand, low occupancy, frequent downtime or high local costs |
| No full payback | The ride fails to generate a positive operating cash contribution after recurring expenses |
A six-month recovery period is possible only when several favorable conditions occur together. It should not be treated as a standard result for every amusement park pendulum ride.
Likewise, a longer recovery period does not always mean the equipment is a poor investment. A large landmark attraction may also support park attendance, brand visibility, admission pricing and secondary spending. These benefits should be measured separately and conservatively.
Payback Period and ROI Are Not the Same
The payback period measures how long it takes to recover the initial project investment.
Return on investment, or ROI, compares the return generated during a defined period with the amount invested.
A project can have a relatively short payback period but still face high future maintenance or refurbishment costs. Another project may take longer to recover its capital while producing broader benefits for the park.
A simple annual cash ROI can be calculated as:
Simple Annual Cash ROI = Annual Operating Cash Contribution ÷ Total Installed Project Cost × 100%
This calculation normally excludes accounting depreciation, income tax and financing interest unless those items are deliberately included.
Step 1: Calculate the Total Installed Project Cost
The factory price alone is not the correct basis for calculating pendulum ride ROI. Investors should use the total amount required to place the ride into legal commercial operation.
| Cost category | Items to include |
| Equipment | Selected model, passenger capacity, control system, restraints, lighting, theme and customization |
| Export and logistics | Packaging, inland transport, ocean freight, insurance, port charges and destination transport |
| Import expenses | Customs duty, import tax, customs clearance and document fees |
| Site work | Soil investigation, foundation, drainage, queue area, fencing and operator area |
| Electrical work | Power supply, cabling, distribution cabinet, grounding and lighting |
| Installation | Crane, tools, local labor, technical personnel, travel, accommodation and commissioning |
| Compliance | Design review, inspection, approval, permits, insurance and document translation |
| Opening reserve | Spare parts, training, marketing, consumables, working capital and contingency |
The total can be expressed as:
Total Installed Project Cost = Equipment + Logistics + Import Costs + Civil Work + Electrical Work + Installation + Compliance + Initial Spare Parts + Opening Reserve
The quotation should clearly state whether it is based on EXW, FOB, CIF or another trade term. These terms do not cover the same delivery responsibilities.
For product price categories and detailed cost factors, see the pendulum ride cost guide.

Step 2: Estimate Actual Passenger Throughput
Seat capacity is important, but it does not show how many paying passengers the ride can serve in a day. Investors must consider the complete operating cycle.
Calculate the Complete Cycle Time
A complete cycle includes:
- Programmed ride time
- Braking and stopping
- Passenger unloading
- Passenger loading
- Restraint checks
- Operator safety checks
The calculation is:
Cycles per Hour = 60 ÷ Complete Cycle Time in Minutes
If a complete cycle takes seven minutes:
60 ÷ 7 = approximately 8.57 cycles per hour
Operators must not shorten safety checks to increase capacity. Loading procedures and restraint inspections should follow the operating manual and local regulations.
Calculate Theoretical Hourly Capacity
Theoretical Riders per Hour = Number of Seats × Cycles per Hour
For example, a hypothetical 23-seat ride with a seven-minute complete cycle has a theoretical capacity of:
23 × 8.57 = approximately 197 riders per hour
This assumes that every seat is filled and that the equipment operates without interruption. Real performance is normally lower.
Include Occupancy and Equipment Availability
A more useful formula is:
Actual Riders per Day = Seats × Cycles per Hour × Operating Hours × Occupancy Rate × Availability Rate
The occupancy rate is the average percentage of seats filled across all cycles.
The availability rate is the percentage of scheduled time during which the ride is ready and permitted to operate.
Availability may be reduced by:
- Weather
- Daily inspections
- Cleaning
- Scheduled maintenance
- Technical interruptions
- Delayed loading
- Staff breaks
- Local operating restrictions
This distinction prevents investors from treating theoretical capacity as guaranteed ticket volume.

Step 3: Choose the Correct Revenue Model
Pendulum ride revenue should be calculated differently depending on how the park charges visitors.
Pay-Per-Ride Venues
For funfairs, carnivals, scenic attractions and parks that sell a separate ticket for each ride:
Daily Direct Revenue = Actual Riders per Day × Average Revenue per Rider
The average revenue per rider may be lower than the advertised ticket price because of:
- Multi-ride packages
- Recharge card bonuses
- Group discounts
- Promotional tickets
- Complimentary rides
- Revenue-sharing commissions
Use the average amount actually collected rather than the highest listed ticket price.
Monthly direct revenue is:
Monthly Direct Revenue = Daily Direct Revenue × Actual Operating Days
Operating days should reflect weather, seasonality, planned closures and local demand.
Admission-Included Theme Parks
When the pendulum ride is included in the general admission price, it does not produce a separate ticket payment each time someone rides.
Its commercial contribution may come from:
- Incremental park attendance
- Higher admission prices
- Longer visitor stays
- More repeat visits
- Premium access or fast-pass sales
- Increased food, beverage, photo or merchandise spending
- Stronger visual marketing and social media exposure
Only revenue that can reasonably be attributed to the attraction should be included. The park’s total admission revenue should not be assigned to one ride.
Seasonal and Mobile Operations
Carnival operators and mobile amusement businesses may calculate performance by event or operating season.
They should also include:
- Transport between venues
- Setup and dismantling
- Site rental
- Revenue-sharing fees
- Staff travel and accommodation
- Storage
- Number of profitable events per year
A ride that performs well at one major festival may still have a long annual payback period if it remains unused for much of the year.

Step 4: Estimate Recurring Operating Costs
Gross revenue is not profit. The following costs should be deducted before calculating the payback period.
Electricity
Electricity cost depends on the model, rated power, actual duty cycle, number of daily cycles, auxiliary lighting and local energy price.
Do not automatically multiply rated motor power by all opening hours. Ask the manufacturer for model-specific electrical data and calculate consumption according to the actual operating program.
Labor
The staffing plan may include:
- Main operator
- Loading and restraint-check assistant
- Ticketing staff
- Queue attendant
- Maintenance technician
- Additional security during busy periods
Staffing should meet the operating manual and local regulatory requirements.
Maintenance and Spare Parts
Maintenance expenses may include:
- Lubrication
- Fastener inspections
- Structural checks
- Restraint inspections
- Brake-system checks
- Electrical inspections
- Bearing and reducer service
- Wear parts
- Nondestructive testing
- Annual inspection
- Specialist technical visits
A preventive maintenance reserve should be included even when no failure has occurred. For more detail, refer to the pendulum ride maintenance checklist.
Insurance and Compliance
Depending on the destination, the operator may need to budget for:
- Public liability insurance
- Annual inspection
- Operating permits
- Third-party testing
- Certification renewal
- Staff licensing or training
Marketing and Payment Costs
Possible expenses include:
- Opening campaigns
- Online advertising
- Promotional discounts
- Photography and video production
- Payment processing
- Ticket platform charges
- Agent or event-partner commissions
Downtime
Downtime reduces ticket sales and may also affect visitor confidence, event income and nearby secondary spending.
Equipment quality, preventive maintenance, critical spare parts and technical response time therefore influence both operating cost and pendulum ride profitability.
Step 5: Calculate Operating Cash Contribution and Payback
Once monthly revenue and recurring cash expenses have been estimated:
Monthly Operating Cash Contribution = Attributable Monthly Revenue – Recurring Monthly Cash Operating Costs
The simple payback calculation is:
Payback Period in Months = Total Installed Project Cost ÷ Average Monthly Operating Cash Contribution
If the monthly operating cash contribution is zero or negative, the project does not have a normal payback period under the current assumptions.
This calculation should use an average across peak, normal and low seasons. Using only the best holiday or weekend results can make the projected pendulum ride ROI unrealistically high.

Example: How Occupancy Changes Pendulum Ride Revenue
The following example shows how the same ride can produce very different gross revenue under different conditions.
Assume a hypothetical project has:
- 23 seats
- Seven-minute complete cycle time
- Eight scheduled operating hours per day
- USD 4 average revenue per rider
These figures explain the method only. They are not a Carnee Rides quotation, model guarantee or forecast of actual earnings.
| Input | Conservative scenario | Standard scenario | Peak-season scenario |
| Average occupancy | 20% | 35% | 60% |
| Equipment availability | 90% | 95% | 98% |
| Operating days per month | 18 | 24 | 28 |
| Estimated riders per day | 284 | 524 | 927 |
| Estimated riders per month | 5,112 | 12,586 | 25,956 |
| Illustrative gross revenue | $20,448 | $50,344 | $103,824 |
The table demonstrates why a supplier cannot determine payback from seat capacity alone.
These are gross-revenue figures before deducting wages, electricity, maintenance, insurance, tax, marketing and other expenses. Peak-season performance should not be used as a full-year average.
To complete the calculation, subtract all recurring monthly cash costs from the applicable revenue scenario, then divide the total installed project cost by the resulting monthly operating cash contribution.
Which Assumptions Affect ROI the Most?
| Variable | Common forecasting mistake | Better approach |
| Equipment price | Treating the factory price as the complete investment | Use the total installed and approved project cost |
| Seat capacity | Assuming every seat will be filled | Apply a realistic average occupancy rate |
| Cycle time | Using only the programmed ride time | Include loading, unloading and safety checks |
| Operating hours | Assuming continuous operation all day | Include inspections, breaks, weather and downtime |
| Ticket price | Using the highest listed price | Use average revenue actually collected per rider |
| Operating days | Applying peak-season days to the whole year | Separate peak, normal and low seasons |
| Maintenance | Budgeting only after a breakdown | Include preventive maintenance and a spare-parts reserve |
| Secondary revenue | Assigning all nearby sales to the ride | Count only a reasonable attributable share |
A sound financial model should test how the result changes when occupancy, availability, ticket income or operating days are lower than expected.
If a small change in one assumption turns the project from profitable to unprofitable, the investment has a narrow safety margin.

Match the Pendulum Ride Type to Actual Demand
The best ROI does not always come from the largest ride.
Mini and Small Pendulum Rides
Compact models generally require less capital, space and power. They may suit shopping malls, indoor FECs, family parks and venues with moderate visitor volume.
Their revenue ceiling is lower, but their smaller investment may make the project easier to support.
Medium Pendulum Rides
Medium models can balance visual appeal, passenger capacity and investment size. They may suit regional amusement parks, scenic attractions, funfairs and urban entertainment projects.
Their success depends on whether the venue can maintain sufficient demand outside weekends and holidays.
Large and 360-Degree Pendulum Rides
Large spinning pendulum or Frisbee rides can serve as landmark attractions and support higher passenger throughput. They also require more demanding foundations, electrical capacity, installation, inspection and maintenance.
They are better suited to parks with strong thrill-seeking demand, sufficient space and a long-term operating plan.
Before selecting capacity, estimate ride demand as:
Expected Daily Ride Demand = Daily Park Attendance × Eligible Visitor Share × Participation Rate × Average Rides per Participant
The eligible visitor share should account for age, height, health restrictions and audience profile.
The participation rate will depend on ride visibility, ticket price, thrill preference, waiting time, competing attractions and marketing.
What Evidence Should a Manufacturer Provide?
A professional manufacturer should provide model-specific information that can be used in the buyer’s financial calculation.
Ask for:
- Passenger capacity
- Programmed ride duration
- Expected complete cycle time
- Equipment dimensions
- Rated power and electrical requirements
- Static and dynamic load information
- Foundation requirements
- Shipping dimensions and weight
- Installation scope
- Operator requirements
- Maintenance schedule
- Recommended spare-parts list
- Warranty terms
- Technical support procedure
- Included drawings and manuals
- Applicable certificates and technical documents
- Clear quotation inclusions and exclusions
The manufacturer can provide engineering specifications and equipment costs. The buyer must provide local attendance data, ticket prices, labor costs, electricity prices, taxes, insurance and approval expenses.
If you are comparing potential suppliers, the article on the leading pendulum ride manufacturers explains how to evaluate engineering evidence, project references, delivery boundaries and after-sales support.

Can a Pendulum Ride Recover Its Cost in One Season?
It is possible, but only under exceptional conditions.
A one-season payback would normally require a combination of:
- Suitable total installed cost
- Strong and consistent visitor demand
- Separately paid ride tickets
- High average occupancy
- Sufficient operating hours and days
- Limited weather disruption
- High equipment availability
- Controlled recurring expenses
Investors should not use this outcome as the default forecast. A conservative project evaluation should also test lower occupancy, fewer operating days and higher-than-expected costs.
Is a Bigger Pendulum Ride Always More Profitable?
No. A larger model has greater theoretical capacity, but it also requires more capital, space, power, foundation work and maintenance.
If a park cannot fill the additional seats, the larger investment may extend the payback period rather than shorten it.
The correct size is the model that can accommodate peak demand without creating excessive unused capacity during normal operating periods.

Should ROI Be Based on the Factory Price or Installed Cost?
Use the total installed project cost.
Calculating payback from the equipment price alone excludes freight, import charges, foundation, electrical work, installation, approval, training, spare parts and opening reserves. This can make the projected recovery period appear much shorter than it really is.

Can a Manufacturer Guarantee Pendulum Ride ROI?
A responsible manufacturer can provide equipment prices, specifications, operating requirements, installation information and technical support.
It cannot guarantee:
- Local attendance
- Visitor participation
- Ticket sales
- Weather
- Local labor costs
- Electricity prices
- Insurance expenses
- Government approval
- The operator’s management performance
Any guaranteed income or fixed payback claim should be supported by clear, project-specific assumptions.

Plan Your Pendulum Ride Investment With Carnee Rides
Carnee Rides is a professional amusement ride manufacturer in China, serving international projects since 1998. Our product range includes mini, medium, large and 360-degree pendulum rides, with customization available for passenger capacity, dimensions, appearance, lighting, theme and voltage.
To receive a suitable model recommendation and factory quotation, provide:
- Destination country
- Available site dimensions
- Indoor or outdoor location
- Expected daily attendance
- Target visitor group
- Preferred passenger capacity
- Pay-per-ride or admission-included model
- Local ticket price, if applicable
- Local voltage and frequency
- Target opening date
Our team can provide model specifications, factory pricing, site-planning support, foundation information, shipping data, installation guidance, operator documents and after-sales service.
You can compare available pendulum ride models or contact Carnee Rides for a project-specific quotation.
A pendulum ride may recover its investment in approximately six months under strong operating conditions, while another project may require several years or longer. The most reliable estimate always begins with the right equipment type, complete project cost and realistic local operating data.
Editorial note: The formulas and scenarios in this guide are intended for preliminary planning. They do not constitute a revenue guarantee, financial advice or a substitute for local engineering, regulatory and commercial assessment.


