
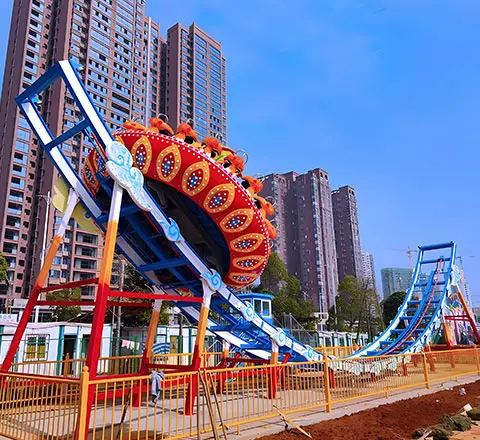


The difference between a theme park that prints money and one that bleeds cash comes down to a surprisingly short list of decisions made before the first shovel hits dirt. Parks with EBITDA margins above 35% share a common DNA: disciplined master planning, ruthless CapEx optimization, and layout designs engineered around guest spending psychology rather than just thrill factor.
💡 Expert Insight from Carnee Rides: > As a premier direct manufacturer of amusement rides, we’ve evaluated hundreds of park plans. The most successful investors don’t just buy rides; they engineer profitable systems. Below, we break down every lever you can pull—from site selection math to new digital revenue streams—sharing the exact blueprints used by our most profitable global partners.
What Makes a Theme Park Truly Profitable in 2026
Most people think attendance numbers define a successful theme park. They’re wrong. A park pulling 2 million visitors a year can lose money, while a park with 600,000 guests can generate 40%+ EBITDA margins. The metric that actually matters is revenue per guest per hour of dwell time — and everything in this article ties back to maximizing that number.
Here are the profitability benchmarks separating winners from money pits in 2026:
- EBITDA margin: Top-performing parks hit 35-45%. The industry median hovers around 20-25%. Below 15%, you’re in trouble.
- Per-capita spending: Leading parks generate $65-$85 per guest (combining admission, F&B, merchandise, and experiences). Underperformers sit below $40.
- CapEx payback period: A well-planned park recoups its initial investment within 4-7 years. Poorly planned projects? Ten years or never.
- Secondary revenue ratio: The most profitable parks earn 45-55% of total revenue from non-ticket sources. If you’re over-reliant on gate admissions, your margins are capped.
One number that gets overlooked constantly: amusement ride utilization rate. A roller coaster that costs $3 million but sits idle 40% of operating hours because of maintenance downtime or poor guest flow is a liability, not an asset. The parks making real money obsess over throughput — guests per hour per ride —, and they design their entire operation around keeping that number high.
The 2026 landscape has also shifted the profitability equation in a specific direction. Energy costs have risen 18-22% across most markets since 2023, according to IAAPA’s 2025 Global Theme Park Outlook. That means operational efficiency isn’t a nice-to-have anymore — it’s a survival requirement. Parks that invested early in solar microgrids and automated operations are seeing 8-12% lower OpEx than competitors who didn’t.
So when we talk about building the most profitable theme park, we’re really talking about engineering a system where every dollar of capital expenditure generates maximum guest spending, every square meter of park space earns its keep, and operational costs stay lean enough to protect margins even in slow seasons.

(See more: How profitable is an amusement park)
Strategic Master Planning for Maximum ROI
A theme park without a master plan is a collection of rides sitting on expensive dirt. A theme park with a great master plan is a revenue-generating machine that compounds returns over a decade or more.
The distinction matters because master planning isn’t just about deciding where to put the roller coaster. It’s a phased financial strategy disguised as a design document.
(See more: How to Master Planning a Theme Park: The Ultimate Guide 2026 )
The Feasibility Study: Your First Investment
Before spending a single dollar on land or equipment, you need a feasibility study that answers three questions with hard data, not gut feelings:
- Is there sufficient demand? This means mapping your catchment area (typically a 2-hour drive radius), analyzing population density, household income levels, and existing competition. If there are already three family entertainment centers and a regional park within your radius, your demand ceiling drops significantly.
- What’s the realistic attendance projection? Overly optimistic attendance forecasts have killed more theme park projects than bad weather ever has. Use penetration rate modeling — typically, 5-8% of your primary market (60-minute drive) and 2-3% of your secondary market (120-minute drive) will visit annually.
- What’s the minimum viable investment to capture that demand? This is where most developers go wrong. They design the park they want to build instead of the park the market needs. (For help deciding on the exact format to match your market, read our guide comparing the most profitable entertainment park types, from indoor FECs to outdoor theme parks.)
The 10-Year Theme Park Master Plan Structure
Top-performing parks don’t build everything at once. They plan in phases, typically structured like this:
| Phase | Timeline | Focus | Typical Investment |
| Phase 1 | Years 1-2 | IP-driven overlays, technology upgrades, and international expansion | 40-50% of total CapEx |
| Phase 2 | Years 3-4 | Expansion zone, secondary attractions, themed area | 25-30% of total CapEx |
| Phase 3 | Years 5-7 | Premium experiences, water park addition, hotel/resort | 15-20% of total CapEx |
| Phase 4 | Years 8-10 | IP-driven overlays, technology upgrades, international expansion | 10-15% of total CapEx |
The genius of phased planning is that each phase funds the next. Phase 1 revenue finances Phase 2 construction, which drives attendance growth that finances Phase 3. This compounding cycle is how mid-size parks grow into regional powerhouses without drowning in debt.
IP Strategy: Build Your Own or License?
Licensing a well-known IP (intellectual property) can boost opening-year attendance by 20-30%, but the royalty fees — typically 8-15% of themed-area revenue — eat into margins permanently. Building original IP is cheaper long-term but requires stronger creative execution and marketing spend to establish brand recognition.
My recommendation for most new amusement parks: start with original theming in Phase 1, keep the IP budget for Phase 2 or 3 when you have revenue data to justify the licensing costs. Too many operators blow their budget on IP rights before they even know if their market will support the base attendance numbers.

Site Selection and Market Demographics That Drive Attendance
You can build the most beautifully designed theme park on the planet, and it will fail if it’s in the wrong location. Site selection is the single highest-leverage decision in the entire development process — and it’s irreversible.
The Population Math
Here’s the benchmark that experienced developers use: your primary catchment area (60-minute drive time) needs a minimum population of 2 million people for a mid-size theme park, or 5 million+ for a large-scale destination park. Drop below those thresholds, and you’re relying on tourism draw, which is possible but dramatically riskier.
But the raw population isn’t enough. You need to layer in:
- Household disposable income: Your target market needs enough discretionary spending for a family of four to afford a $200-$400 day out. In most markets, that means a median household income above $45,000.
- Age demographics: Parks skewing toward families need a high concentration of households with children aged 4-14. Thrill parks need a strong 15-35 demographic. Check census data carefully — a retirement-heavy catchment area won’t fill your coasters.
- Competition density: One major competitor within your primary radius isn’t necessarily a deal-breaker (it proves demand exists), but three or more signals market saturation.
Tourism Corridor Positioning
The smartest site selections piggyback on existing tourism infrastructure. A theme park located 20 minutes from a major resort destination, international airport, or cruise port captures visitors who are already in “spending mode.” This is why Orlando works so well — it’s not just Disney and Universal pulling people in; it’s the entire ecosystem of hotels, restaurants, and attractions creating a self-reinforcing tourism magnet.
For emerging markets, look for cities with growing domestic tourism, new highway or rail connections, and government tourism development incentives. Several Southeast Asian and Middle Eastern markets are offering 10-15 year tax holidays for major entertainment developments in 2026.
Climate Considerations: Most Developers Underestimate
Outdoor parks in extreme climates face a brutal math problem. If your operating season is limited to 180 days due to heat, cold, or monsoon conditions, your per-day revenue requirement doubles compared to a 300+ day park. Indoor climate-controlled zones, covered walkways, and water-based cooling attractions aren’t luxuries in hot climates — they’re revenue protection.
Parks in northern climates increasingly use seasonal event programming (Halloween events, winter light festivals) to extend their operating calendar to 280+ days, adding 15-25% to annual revenue without major CapEx.

Phased Development: How to Open Profitably and Scale Strategically
The biggest financial mistake in theme park development? Building too much, too fast.
I’ve seen developers pour $150 million into a grand opening that tries to compete with parks that took 30 years to reach their current scale. The result is almost always the same: impressive opening-day photos, followed by years of debt service that crushes operating margins.
The Lean Phase 1 Approach
A profitable Phase 1 doesn’t need to be massive. It needs to be focused. Here’s what a high-impact opening typically includes:
- One anchor attraction that generates media coverage and defines the park’s identity (a signature coaster, a dark ride, or a unique themed experience)
- 6-10 supporting rides across family, thrill, and children’s categories to ensure broad demographic appeal
- Two themed F&B locations (one sit-down, one quick-service) positioned at high-traffic intersections
- One flagship retail store near the exit (yes, the exit — we’ll cover why in the layout section)
- Core infrastructure designed to support Phase 2 and 3 expansion without reconstruction
The critical insight: your Phase 1 infrastructure (utilities, pathways, backstage areas) should be built to 70-80% of your ultimate park capacity, even though your Phase 1 attractions only fill 30-40% of the final footprint. Retrofitting infrastructure is 3-4x more expensive than building it right the first time.
The Reinvestment Cycle
Profitable parks follow a disciplined reinvestment formula: allocate 8-12% of annual revenue to new attractions and upgrades. This isn’t optional. Parks that stop adding new experiences see attendance decline 5-10% annually as the novelty fades.
The reinvestment cycle works like this:
- Phase 1 opens and generates baseline revenue
- Year 2-3 revenue funds a new attraction announcement, which drives advance ticket sales and media coverage
- The new attraction opens in Year 3-4, boosting attendance 10-20%
- Higher attendance generates more revenue for the next reinvestment cycle
This compounding effect is why the most profitable parks in the world aren’t the ones that spent the most upfront — they’re the ones that maintained the most consistent reinvestment cadence over time.

Strategic Ride Sourcing: How to Reduce CapEx by 30-60%
Ride procurement is typically 40-55% of total park CapEx. Which means your choice of ride manufacturer is, dollar for dollar, the most impactful sourcing decision you’ll make. And here’s where most Western developers leave enormous money on the table.
The China Manufacturing Advantage
A Chinese amusement ride manufacturer can deliver comparable ride systems at 30-60% lower cost than European or American OEMs. That’s not a typo, and it’s not because of inferior quality — it’s because of fundamentally different cost structures in steel fabrication, labor, and supply chain proximity.
Consider the numbers: a mid-size family coaster from a top European manufacturer runs $4-7 million. A comparable ride from a reputable Chinese manufacturer — same track gauge, same safety systems, same throughput capacity — comes in at $1.8-3.5 million. On a 15-ride park build, that delta can save you $15-25 million in CapEx. That’s the difference between a park that’s profitable in Year 3 versus Year 8.
But — and this is crucial — not all Chinese manufacturers are created equal. The gap between the best and worst suppliers in China is wider than in any other manufacturing region. You need to know exactly what to evaluate. To shortcut your vetting process and avoid costly mistakes, we have compiled an objective list of the top 10 amusement park rides manufacturers in China based on export volume, safety certifications, and build quality.
How to Evaluate a China Amusement Park Ride Supplier
Here’s the evaluation framework that separates smart sourcing from risky purchasing:
- Factory age and track record: Look for manufacturers with 10+ years of operation and a verifiable installation base of 200+ rides across multiple countries. Ask for reference parks you can contact directly.
- International certifications: Non-negotiable. The manufacturer must hold TUV, CE, and/or ASTM certification for the specific ride categories you’re purchasing. Certificates should be current and verifiable with the issuing body.
- In-house engineering capability: The best Chinese manufacturers have their own R&D departments with structural engineers, electrical engineers, and industrial designers. Ask to see their engineering team credentials and recent innovation projects.
- Customization flexibility: Can they modify ride theming, color schemes, car designs, and capacity configurations to match your park’s brand? The top-tier suppliers offer full customization at minimal additional cost — something Western OEMs charge premium fees for.
- After-sales support: This is where many buyers get burned. Confirm the manufacturer provides spare parts inventory, remote technical support, and on-site installation supervision. Get the after-sales terms in writing before signing any contract.
Negotiation Strategies That Work
When sourcing from Chinese manufacturers, bundle purchases deliver the best pricing. Ordering 8-12 rides from a single manufacturer typically unlocks 10-15% additional volume discounts compared to buying rides individually. The manufacturer benefits from production efficiency, and you benefit from lower per-unit costs plus simplified logistics.
Payment terms matter too. The standard structure is 30% deposit, 40% at production milestones, and 30% before shipping. Push for a 10-15% retention held until successful installation and commissioning. Reputable manufacturers accept this because they stand behind their products.
One more thing most buyers miss: shipping and import duty planning. Rides shipped as knock-down kits (partially disassembled) often qualify for lower tariff classifications than fully assembled units. A good freight forwarder specializing in heavy machinery can save you 5-8% on landed costs through proper HS code classification.
Navigating Global Safety Standards (TUV, CE, ASTM) for Imported Rides
Safety compliance isn’t just a regulatory checkbox — it’s the foundation of your park’s reputation, insurance costs, and long-term viability. One serious incident can destroy a park’s brand permanently. So when sourcing rides internationally, especially from a China amusement ride manufacturer, your certification due diligence needs to be bulletproof.
The Key Certifications Explained
| Certification | Region | What It Covers | Why It Matters |
| CE Marking | European Union | Machinery Directive 2006/42/EC, electromagnetic compatibility | Ensures consistent manufacturing processes, required by most serious buyers |
| TUV Certification | Germany / Global | Independent third-party testing of structural integrity, electrical systems, and safety mechanisms | Considered the gold standard; significantly reduces insurance premiums |
| ASTM F24 | United States | Committee F24 standards for amusement rides and devices | Mandatory for parks operating in the US; covers design, manufacture, testing, and operation |
| ISO 9001 | International | Quality management systems | Ensures consistent manufacturing processes; required by most serious buyers |
| EN 13814 | Europe | Specific standard for fairground and amusement park machinery and structures | The most comprehensive ride-specific safety standard in the world |
Factory Audit Protocols You Should Demand
Certificates on paper aren’t enough. Here’s the audit checklist experienced buyers use when visiting a Chinese ride factory:
- Welding quality documentation: Request welding procedure specifications (WPS) and welder qualification records. Critical welds on ride structures should be inspected using non-destructive testing (NDT) methods — ultrasonic or radiographic.
- Material traceability: Every piece of structural steel should have mill certificates traceable to the source. If a manufacturer can’t show you material certificates, walk away.
- Electrical system compliance: Control systems should use internationally recognized PLC brands (Siemens, Allen-Bradley, Schneider). Proprietary or unbranded control systems are a red flag for long-term maintenance.
- Load testing records: Every ride should undergo full load testing at 120-150% of rated capacity before shipping. Ask to witness the test or review video documentation.
- Third-party inspection reports: Hire an independent inspection company (SGS, Bureau Veritas, or TUV) to conduct pre-shipment inspection. The cost is typically $2,000-5,000 per ride — trivial compared to the risk of receiving non-compliant equipment.
A critical point many first-time buyers miss: certification requirements vary by destination country. A ride that’s CE-certified for Europe may need additional modifications or testing to meet ASTM standards for a US installation. Always confirm your destination market’s specific requirements before placing an order, and ensure the manufacturer has experience exporting to that market.
The ASTM International standards database provides the complete list of applicable standards for amusement rides and devices, which should be your starting reference for US-market compliance.

Comparing Ride Categories: Which Amusement Attractions Deliver the Highest Revenue Per Square Meter
Not all theme park rides are equal investments. A $5 million attraction that draws 800 riders per hour in a 500-square-meter footprint generates dramatically different returns than a $5 million attraction that handles 400 riders per hour across 2,000 square meters. Understanding these economics is how you build a ride portfolio that maximizes revenue per square meter.
Revenue Performance by Ride Category
| Ride Category | Typical CapEx | Hourly Throughput | Footprint | Revenue/m² Rating | Sourcing from China |
| Family Coasters | $1.5-4M | 700-1,200/hr | 800-2,000 m² | ★★★★★ | Excellent availability; 40-55% savings |
| Flat Rides (Pendulum, Swing, Flying Chair) | $200K-1.5M | 500-900/hr | 200-600 m² | ★★★★★ | Best value category; 50-60% savings |
| Dark Rides | $3-15M | 600-1,000/hr | 1,000-3,000 m² | ★★★★ | Ride systems from China; theming often local |
| Water Rides | $2-8M | 500-800/hr | 1,500-4,000 m² | ★★★ | Good availability; water treatment systems need local spec |
| Ferris Wheels | $1-10M | 200-400/hr | 500-1,500 m² | ★★★ | China dominates global supply; 45-60% savings |
| Major Thrill Coasters | $8-30M | 800-1,400/hr | 3,000-10,000 m² | ★★ | Limited for top-tier; mid-tier available |
| Bumper Cars | $80K-300K | 300-500/hr | 200-500 m² | ★★★★★ | Exceptional value; Chinese manufacturers lead globally |
| Trackless Trains / Sightseeing Vehicles | $30K-150K | 100-300/hr | Variable (route-based) | ★★★ | China is the primary global source |
The Flat Ride Advantage: High Throughput, Low CapEx
Here’s something most first-time park developers underestimate: flat rides are the workhorses of profitable parks. A well-chosen portfolio of 6-8 flat rides (swing rides, pendulum rides, flying chairs, drop towers) can cost less than a single major coaster while delivering comparable total throughput and broader demographic appeal.
Flat rides also have three underappreciated advantages:
- Lower maintenance costs: Simpler mechanical systems mean less downtime and lower spare parts inventory
- Faster installation: Most flat rides install in 2-4 weeks versus 3-6 months for coasters
- Flexible placement: Their compact footprints allow strategic positioning near high-margin retail and F&B zones
Chinese manufacturers are particularly strong in the flat ride category. Companies producing swing rides, pendulum rides, and bumper cars have refined their manufacturing processes over decades of high-volume production, resulting in excellent quality-to-cost ratios.
Optimizing Amusement Park Layout to Increase Guest Spending
Park layout is where design meets revenue engineering. The path a guest walks from the entrance to their favorite ride and back to the exit is either a carefully designed spending journey or a missed opportunity. The difference between these two scenarios is worth millions in annual revenue.
Hub-and-Spoke vs. Loop: Which Layout Wins?
Two dominant layout philosophies compete in theme park design:
Hub-and-Spoke (used by Disney’s Magic Kingdom, many large-scale parks): Guests enter a central hub and choose paths radiating outward to themed lands. This design excels at distributing crowds evenly, reducing congestion, and giving guests a sense of choice. The downside? Guests can beeline to one area and miss others entirely.
Loop/Circuit (used by many regional parks and European parks): A single main pathway guides guests through the entire park in a roughly circular route. This ensures maximum exposure to every attraction, retail, and F&B location. The downside? It can create bottlenecks and feel less immersive.
The most profitable parks in 2026 use a hybrid approach: a modified loop with shortcut paths. The main guest flow follows a circuit that passes every revenue zone, but experienced visitors can take shortcuts to reach specific attractions quickly. This balances first-visit discovery (high spending) with repeat-visit convenience (high satisfaction and return rates).
(See more: How to Zone a Theme Park: Park Types, Zoning Logic, and Global Examples )
Strategic Placement of Revenue Zones
Spatial design principles that directly impact per-capita spending:
- Main Street retail corridor at the entrance: Guests walk past shops on arrival (planting purchase ideas) and again on departure (when they’re ready to buy). This single design choice can increase merchandise revenue by 20-30%.
- F&B at decision points: Place food outlets at pathway intersections where guests naturally pause to orient themselves. A guest who stops to check the map is 3x more likely to make an impulse food purchase.
- Ride exits through retail: The classic IKEA strategy applied to theme parks. When a guest exits a thrilling ride on an emotional high, they’re in peak impulse-buying mode. Route them through a themed gift shop.
- Restrooms as traffic drivers: Position restrooms adjacent to (but not inside) underperforming retail or F&B zones. Guests seeking restrooms will walk past revenue opportunities they’d otherwise skip.
Minimizing Perceived Wait Times
Perceived wait time — not actual wait time — determines guest satisfaction. A 30-minute wait in a boring queue feels longer than a 45-minute wait in an entertaining one. The layout implications:
- Design queue areas with shade, theming, and interactive elements
- Use switchback queues that keep the line moving visually (guests hate standing still)
- Position queue entrances so guests can see the ride in action from the queue — watching others scream and laugh builds anticipation and makes the wait feel worthwhile
- Place digital wait-time displays at queue entrances so guests can make informed decisions rather than committing to a line and growing frustrated
The Psychology of Guest Flow: Placement of Anchor Attractions and Revenue Zones
Every major retailer knows this trick: put the milk at the back of the store so customers walk past everything else. Theme parks operate on the same principle, just at a much larger scale and with much higher stakes.
The Anchor Attraction Placement Strategy
Your headline ride — the one featured in your marketing, the one guests come specifically to experience — should be positioned at the deepest point of the park, as far from the entrance as practically possible. This single decision forces every guest to walk past dozens of revenue touchpoints on their way to the anchor.
Disney has perfected this for decades. Space Mountain sits at the far end of Tomorrowland. Expedition Everest is in the back corner of Animal Kingdom. The journey to reach these rides passes through themed retail streets, snack carts, photo opportunities, and secondary attractions that capture spending along the way.
For a new park with a limited budget, the math is straightforward:
Place your most expensive, most marketed attraction at the back. Place your second-biggest draw at a midpoint on the opposite side. This creates a natural cross-park traffic pattern that maximizes exposure to every revenue zone between them.
The Disney “Weenie” Principle: Using Landmarks as Guest Magnets
Walt Disney called them “weenies” — tall, visually striking landmarks that draw guests forward through the park. A Ferris wheel is visible from the entrance. A coaster lift hill towering above a themed land. A castle at the end of Main Street. These visual magnets serve a critical revenue function: they keep guests moving deeper into the park instead of clustering near the entrance.
From a sourcing perspective, this is another reason Ferris wheels and drop towers deliver outsized value. Their height makes them natural weenies that shape guest flow patterns across the entire park. A $1.5 million Ferris wheel sourced from a Chinese manufacturer does double duty: it’s both a revenue-generating attraction and a park-wide navigation beacon that drives foot traffic past your highest-margin zones.
Behavioral Economics in Action
Three psychological principles that profitable parks exploit through layout design:
- The Peak-End Rule: Guests judge their entire experience based on the emotional peak (usually the anchor ride) and the final moments (the exit experience). This is why the exit pathway should be your best retail environment — a beautifully themed shopping street with music, lighting, and merchandise that captures the emotional afterglow of the park experience.
- Loss Aversion: “Limited edition” merchandise available only in specific themed areas creates urgency. Guests who pass a unique item and don’t buy it will feel regret, and many will backtrack to purchase. Strategic signage (“Only available in Adventureland!”) amplifies this effect.
- The Gruen Transfer: Named after architect Victor Gruen, this is the moment when a purposeful shopper becomes an impulse browser. Theme park layouts trigger this by transitioning guests from purposeful walking (heading to a ride) through immersive themed environments that slow their pace and shift their mindset from “getting somewhere” to “experiencing something.” That mental shift is when wallets open.

Balancing CapEx and OpEx for Sustainable Theme Park Profitability
Here’s a tension that sinks parks: spending too much on capital expenditure leaves insufficient reserves for operations, but underspending on CapEx results in a park that doesn’t attract enough guests to cover operating costs. Getting this balance right is genuinely the hardest financial challenge in the industry.
The Benchmark Ratios
Based on data from profitable mid-size and large-scale parks operating in 2026:
| Financial Metric | Healthy Range | Danger Zone |
| Total CapEx to Year 1 Revenue ratio | 3:1 to 5:1 | Above 7:1 |
| Annual OpEx as % of Revenue | 55-65% | Above 75% |
| Staffing as % of OpEx | 35-45% | Above 55% |
| Maintenance as % of Revenue | 6-10% | Below 4% (deferred maintenance risk) |
| Energy as % of OpEx | 8-14% | Above 18% |
| Annual Reinvestment as % of Revenue | 8-12% | Below 5% |
That CapEx-to-revenue ratio is the number that kills most projects. If you spend $100 million building a park that generates $15 million in Year 1 revenue, you’re at a 6.7:1 ratio — already in uncomfortable territory. The same $100 million park needs to generate $20-33 million in Year 1 to be on a healthy trajectory.
Where CapEx Goes Wrong
Three common CapEx mistakes that destroy profitability:
Over-theming Phase 1. Elaborate rockwork, custom facades, and cinematic-quality environments look incredible but can consume 25-35% of your total budget on elements that don’t directly generate revenue. A smarter approach: invest in “good enough” theming for Phase 1 that creates atmosphere without breaking the bank, then upgrade to premium theming in later phases when cash flow supports it.
Ignoring infrastructure costs. First-time developers budget carefully for rides and theming, then get blindsided by the $15-25 million in site preparation, utilities, parking, and backstage facilities that every park requires. Infrastructure typically represents 20-30% of total CapEx — budget for it explicitly.
Buying rides based on “wow factor” instead of ROI. A $20 million signature coaster might be the most thrilling ride in the region, but if a $6 million family coaster sourced from a Chinese manufacturer delivers 80% of the guest satisfaction at 30% of the cost, the family coaster is the smarter Phase 1 investment. Save the mega-coaster for Phase 3 when your revenue base can support it.
OpEx Optimization Levers
On the operational side, the three biggest cost reduction opportunities in 2026 are staffing efficiency (covered in the next section), energy management, and preventive maintenance programs. Parks that implement predictive maintenance using IoT sensors on ride systems report 15-25% reductions in maintenance costs and 30-40% reductions in unplanned downtime — both of which directly impact the bottom line.
Staffing Models, Automation, and Energy Efficiency in 2026
Labor is the single largest operating expense for any theme park. It’s also the area where 2026 technology is creating the most dramatic cost reductions — if you’re willing to invest in the right systems.
AI-Driven Queue Management
Virtual queue systems have evolved far beyond basic “take a number” apps. In 2026, AI-powered queue management platforms analyze real-time crowd density, ride throughput, weather patterns, and historical data to dynamically adjust wait times, suggest alternative attractions to guests, and redistribute foot traffic across the park.
The financial impact is significant. Parks using the advanced queue management report:
- 12-18% increase in ride utilization rates (fewer rides sitting under capacity while others have 90-minute waits)
- 8-15% increase in per-capita F&B spending (guests redirected to food zones during peak ride wait periods)
- 20-25% reduction in queue-area staffing (fewer line management personnel needed when the system self-optimizes)
Automated Ride Operations
Full ride automation — where the ride cycle runs without a human operator — remains limited to simpler attractions for safety and regulatory reasons. But semi-automated operations are transforming staffing models. Automated dispatch systems, RFID-based restraint verification, and computer vision safety monitoring allow a single operator to manage what previously required two or three staff members.
The savings compound quickly. Reducing each ride’s staffing requirement by one person across 15 rides, operating 10 hours per day for 300 days, eliminates roughly 45,000 labor hours annually. At average theme park wage rates, that’s $500,000-$700,000 in annual savings — enough to fund a new flat ride every year.
Solar Microgrids and Energy Independence
Energy costs have become a profitability threat that smart operators are addressing aggressively. A mid-size theme park consumes 8-15 million kWh annually. At 2026 commercial electricity rates, that’s $800,000-$2 million per year in many markets.
Parks installing solar microgrids on parking structures, backstage buildings, and shade canopies are offsetting 30-50% of their electricity consumption. The ROI math works: a $2 million solar installation generating $400,000-$600,000 in annual energy savings pays for itself in 3.5-5 years, then delivers pure margin improvement for the remaining 20+ year lifespan of the panels.
Battery storage systems add another layer. By storing solar energy during peak generation and deploying it during evening operations (when many parks run their most energy-intensive lighting and entertainment programs), parks reduce their reliance on expensive peak-rate grid electricity by an additional 15-20%.
Dynamic Staffing Models
The old model — fixed staff schedules regardless of attendance — is dead. Profitable parks in 2026 use demand-forecasting algorithms that predict daily attendance within 5-10% accuracy based on weather, school schedules, local events, and advance ticket sales. Staff schedules flex accordingly.
A park that previously maintained 400 staff on every operating day might now flex between 280 on slow weekdays and 450 on peak Saturdays. The annual labor savings from this approach alone typically run 10-15% of total staffing costs.
Maximizing Revenue Streams Beyond Ticket Sales
If ticket sales represent more than 55% of your total revenue, your park is underperforming financially. Full stop. The most profitable parks in the world have flipped this ratio, generating 45-55% of revenue from non-admission sources. That’s where the real margin lives.
The Revenue Mix of Top-Performing Parks
| Revenue Stream | Industry Average | Top Performers | Margin |
| Admissions / Gate | 55-60% | 40-48% | 85-90% |
| Food & Beverage | 20-25% | 22-28% | 70-80% |
| Merchandise / Retail | 10-12% | 12-16% | 55-65% |
| Games, Upcharges, VIP | 3-5% | 8-12% | 80-90% |
| Sponsorship & Licensing | 1-2% | 3-5% | 90-95% |
| Events & Rentals | 1-3% | 3-6% | 60-75% |
| Digital / Data | <1% | 2-4% | 85-95% |
Look at those margin columns. Admission revenue has the highest margin, but it’s volume-constrained by park capacity and price sensitivity. The secondary streams — especially games, VIP experiences, sponsorships, and digital — offer margins above 80% with significant growth headroom.
Season Pass Strategy
Season passes seem counterintuitive — you’re giving away unlimited visits at a discount. But the data tells a different story. Season pass holders visit 5-8 times per year and spend 2-3x more on F&B and merchandise per visit than single-day guests. They also bring friends and family who pay full price.
The optimal season pass pricing: 1.5-2x the single-day admission price. At that level, guests feel they’re getting a deal after just two visits, while the park captures dramatically higher lifetime spending per guest.
VIP Experiences and Dynamic Pricing
Front-of-line passes, VIP tours, reserved seating for shows, and premium dining experiences serve a dual purpose: they generate high-margin revenue from guests willing to pay more, and they improve the experience for standard guests by reducing queue lengths.
Dynamic pricing — adjusting admission prices based on predicted demand — is now standard practice at top parks. A Tuesday in October might be priced at $45, while a Saturday in July costs $89. This smooths attendance curves, reduces peak-day overcrowding, and increases overall revenue by 8-15% compared to fixed pricing.
F&B as a Profit Center, Not a Necessity
Most underperforming parks treat food as a service they’re obligated to provide. Profitable parks treat F&B as a themed entertainment experience that happens to involve eating. The difference in per-capita F&B spending between these two approaches is staggering — often $8-12 per guest.
Tactics that work:
- Themed dining experiences tied to ride narratives (eat in the “explorer’s camp” after the adventure ride)
- Instagram-worthy food presentations that guests photograph and share (free marketing)
- Mobile ordering that eliminates the “I don’t want to wait in a food line” barrier
- All-you-can-eat dining plans sold at the gate (guests perceive value; the park controls food costs)
Event Hosting and Off-Season Revenue
Corporate events, private parties, Halloween events, holiday festivals, and concert series can generate $2-8 million annually for a mid-size park. These events use existing infrastructure during low-utilization periods, making them almost pure margin. The most successful parks now program 6-10 major events per year, each with unique theming, limited-edition merchandise, and premium pricing tiers.
Digital Revenue and Data Monetization Strategies for Theme Parks
Five years ago, digital revenue was a rounding error for most parks. In 2026, it’s the fastest-growing and highest-margin revenue category in the industry. Parks that invested early in digital infrastructure are now generating $3-8 per guest in pure digital revenue — on top of all physical spending.
The Mobile App as a Revenue Platform
A park’s mobile app is no longer just a map and wait-time tracker. It’s a commerce platform that captures spending throughout the guest journey:
- Pre-visit: Advance ticket purchases, dining reservations, VIP upgrades, parking pre-pay
- In-park: Mobile food ordering, virtual queue upgrades ($15-25 per ride per guest), digital photo packages, interactive game purchases, location-triggered merchandise offers
- Post-visit: Photo and video package upsells, season pass conversion offers, merchandise shipping for items guests saw but didn’t buy
The virtual queue upgrade alone is a goldmine. Guests pay $15-25 to skip the line on popular attractions. With zero marginal cost (the ride runs the same cycle regardless), this is essentially a 95%+ margin product. Parks with 5-6 eligible attractions report $2-4 million annually from virtual queue sales alone.
Digital Photo Packages
On-ride cameras and themed photo opportunities throughout the park generate photos that guests want but can only purchase through the park’s platform. The shift from printed photos to digital packages has transformed this from a low-margin physical product to a high-margin digital one.
Pre-sold “all-day photo packages” at $30-50 per group capture revenue upfront and encourage guests to seek out more photo opportunities (driving them past more revenue zones). The cost of delivering digital photos is essentially zero after the camera infrastructure investment, making this a 90%+ margin product.
First-Party Data as Strategic Asset
Every app interaction, purchase, ride scan, and location ping generates data that has value far beyond the individual transaction. Profitable parks in 2026 are using first-party guest data to:
- Personalize marketing: Guests who rode the family coaster three times get targeted ads for the new family attraction opening next season. Conversion rates on personalized campaigns run 3-5x higher than generic marketing.
- Optimize operations: Heat maps of guest movement patterns inform ride scheduling, F&B staffing, and entertainment programming. If data shows 40% of guests cluster in the north end of the park between 2-4 PM, that’s where you deploy your mobile food carts.
- Secure sponsorship deals: Brands pay premium rates for sponsorship when you can prove demographic reach with hard data. “Our park attracts 180,000 families with children aged 4-12 and household income above $75,000” is a sponsorship pitch that commands top dollar.
Privacy compliance is non-negotiable here. All data collection must comply with GDPR, CCPA, and equivalent local regulations. But within those frameworks, the commercial value of first-party theme park data is substantial — and most parks are still barely scratching the surface.

Real-World Profitability Case Studies: What Successful Parks Did Differently
Theory is useful. Real results are better. Here are three case studies of parks that achieved profitability faster than industry averages — and the specific decisions that made the difference.
Case Study: Regional Family Park in Southeast Asia — Profitable in 28 Months
A 15-hectare family-focused park opened in a Southeast Asian market with a primary catchment population of 3.2 million. Total Phase 1 investment: $38 million.
What they did differently:
- Sourced 80% of rides from Chinese manufacturers, reducing ride CapEx from a projected $22 million to $11 million — a 50% savings that fundamentally changed the payback timeline
- Opened with 12 rides (8 flat rides, 2 family coasters, 1 dark ride, 1 water ride) instead of the consultant-recommended 18, focusing budget on the highest-throughput attractions
- Designed the park layout as a modified loop with the dark ride and lead coaster at opposite far ends, forcing cross-park traffic past all F&B and retail zones
- Launched a season pass program at opening, priced at 1.8x single-day admission, converting 22% of first-year visitors to pass holders
Results: Year 1 attendance hit 620,000 (15% above projections). Per-capita spending reached $42, with 48% coming from non-admission sources. The park reached operational profitability in month 18 and full CapEx payback is projected for month 40.
Case Study: Mid-Size Thrill Park in the Middle East — 35% EBITDA by Year 3
A 22-hectare park targeting the 15-35 demographic in a Gulf state market. Total Phase 1 investment: $85 million, with an indoor climate-controlled zone representing 30% of the ride area.
What they did differently:
- Split ride sourcing strategically: two headline coasters from European manufacturers for marketing credibility, plus 10 supporting rides from a Chinese amusement ride manufacturer at 45% savings. The blended approach saved $18 million while maintaining premium brand perception.
- Built the indoor zone first as a year-round revenue anchor, with outdoor expansion in Phase 2 timed for cooler-season operation
- Implemented dynamic pricing from Day 1, with weekday rates 40% below weekend rates, smoothing attendance and increasing total annual visits by an estimated 12%
- Invested heavily in a mobile app with virtual queue, digital photos, and in-park purchasing — digital revenue hit 6% of total revenue by Year 2
Results: 35% EBITDA margin by Year 3, driven primarily by the high-margin indoor zone (which operates 365 days versus 240 outdoor days) and aggressive secondary revenue optimization. The park’s per-capita spending of $71 ranks in the top quartile for the region.
Case Study: Seasonal Park Conversion in Eastern Europe — From Failing to 28% EBITDA
An existing 30-year-old park with declining attendance and aging rides was acquired and repositioned. The new ownership invested $25 million over two years in a strategic turnaround.
What they did differently:
- Replaced 6 aging rides with modern equivalents sourced from Chinese manufacturers at a total cost of $4.2 million — less than the replacement cost of a single ride from the park’s original European supplier
- Redesigned the park layout to create a proper anchor-at-the-back flow pattern, relocating the park’s most popular coaster from near the entrance to the far end
- Added 4 seasonal events (spring festival, summer concert series, Halloween, winter lights) that extended the operating calendar from 180 to 275 days
- Installed a solar microgrid on the parking structure that cut energy costs by 35%
Results: Attendance grew 45% over two years. EBITDA swung from -3% to +28%. The seasonal events alone contributed $3.8 million in incremental revenue at 68% margins. Total investment payback is projected at 4.5 years.
The common thread across all three cases: disciplined CapEx management through strategic China sourcing, layout optimization focused on spending psychology, and aggressive development of secondary revenue streams. No single decision made these parks profitable — it was the combination of smart choices across every dimension.
Frequently Asked Questions About Building a Profitable Theme Park
Your Profitability Roadmap: Key Takeaways and Next Steps
Building the most profitable theme park isn’t about having the biggest budget or the most thrilling rides. It’s about making the right decisions in the right sequence. Here’s your prioritized action checklist:
Phase A — Foundation (Months 1-6):
- Commission a professional feasibility study with realistic attendance modeling — not the optimistic version your investors want to see, but the honest one your business plan needs
- Identify 3-5 potential sites and evaluate each against the demographic benchmarks outlined above (2M+ primary catchment, adequate income levels, manageable competition)
- Develop a 10-year phased master plan with clear CapEx allocation per phase and reinvestment triggers
Phase B — Design and Sourcing (Months 6-18):
- Design your park layout using the hybrid loop model with anchor attractions at the deepest points and revenue zones at every decision point
- Build your ride portfolio around ROI per square meter, not “wow factor” — prioritize flat rides and family coasters for Phase 1
- Begin manufacturer evaluation with Chinese suppliers: request certifications, schedule factory visits, check reference installations, and negotiate bundled pricing for 8-12 ride packages
- Engage third-party inspection firms (SGS, TUV, Bureau Veritas) for pre-shipment quality assurance
Phase C — Build and Pre-Launch (Months 12-30):
- Build infrastructure to 70-80% of ultimate capacity, even though Phase 1 fills only 30-40% of the footprint
- Develop your mobile app with commerce capabilities (virtual queue, digital photos, mobile ordering) before opening day — not as a Phase 2 afterthought
- Design your season pass program and dynamic pricing model based on comparable market data
- Program your first year of seasonal events to extend the operating calendar and generate off-peak revenue
Phase D — Operations and Optimization (Ongoing):
- Target 45%+ of revenue from non-admission sources by Year 2
- Implement AI-driven queue management and dynamic staffing models to control OpEx
- Maintain the 8-12% annual reinvestment cadence — this is the engine of long-term profitability
- Use first-party guest data to personalize marketing, optimize operations, and secure premium sponsorship deals
The parks that follow this roadmap consistently reach profitability 2-3 years faster than those that wing it. Every decision in this checklist connects back to the core principle: maximize revenue per guest per hour of dwell time while keeping CapEx disciplined and OpEx lean.
If you’re serious about moving forward, your immediate next step is straightforward. Get that feasibility study commissioned. Identify your market. Run the numbers honestly. Then start conversations with ride manufacturers who can deliver the quality your guests expect at a price point that makes your financial model work. The gap between parks that thrive and parks that struggle almost always traces back to the quality of decisions made in these earliest stages — before a single ride is installed or a single ticket is sold.
Ready to maximize your park’s ROI? Do not let middlemen eat into your profit margins. As a premier direct amusement ride manufacturer, Carnee Rides provides not just world-class, fully certified attractions, but end-to-end park layout and profitability consulting.
👉 [Contact our engineering team today] for a free site evaluation, ride mix recommendation, and a direct factory-direct quote that protects your CapEx!


