
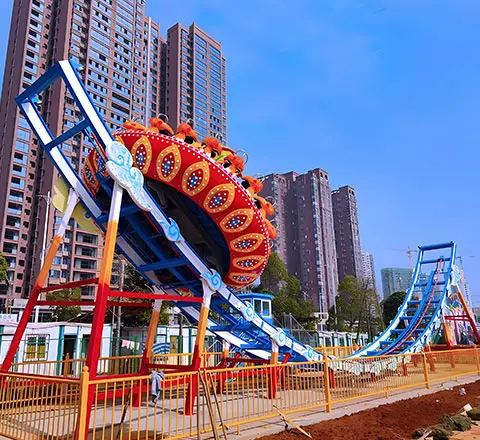


Amusement parks generate net profit margins between 10% and 25% in most operating scenarios — and the best-run parks push well beyond that. Whether you’re evaluating a $1 million family entertainment center or a $200 million regional theme park, profitability hinges on three controllable variables: amusement ride sourcing, revenue diversification, and operating cost discipline. I’ve spent over two decades helping park operators across six continents turn vacant land into profitable entertainment destinations, and the financial patterns are remarkably consistent once you understand the underlying mechanics.
This full financial breakdown covers startup costs, revenue models, operating expenses, break-even timelines, ride-level ROI, and regional profitability differences — all grounded in 2025–2026 industry data from IAAPA, IBISWorld, and real project experience.

How Profitable Is an Amusement Park? The Quick Answer
Average Amusement Park Profit Margins in 2026
Amusement parks are among the most capital-intensive entertainment businesses, but they reward patient, well-planned investment with strong recurring margins. According to IAAPA’s 2025 Global Theme and Amusement Park Outlook, the industry’s median net profit margin sits at approximately 15% for established parks operating at stable attendance levels. IBISWorld’s 2025 U.S. Amusement Parks Industry Report places the domestic average slightly higher at 17.2%, driven by post-pandemic attendance recovery and aggressive dynamic pricing adoption.
These margins, however, vary significantly based on scale, geography, and — critically — how intelligently operators source their amusement attractions and manage ongoing maintenance costs.
Profitability by Park Size: Small, Medium, and Large
| Park Tier | Annual Revenue Range | Typical Net Margin | |
| Small Park / FEC | $500K – $2M | 8% – 15% | |
| Mid-Size Regional Park | $2M – $20M | 15% – 22% | |
| Large Theme Park | $50M+ | 20% – 30%+ |
A crucial nuance most financial guides overlook: the margin gap between small and large parks narrows considerably when smaller operators adopt smart equipment procurement strategies. Parks that source rides from a single experienced manufacturer — rather than piecing together equipment from multiple vendors — consistently report lower total project costs and faster time-to-revenue. That procurement decision alone can shift a small park’s margin from 8% into the 13–15% range.

Amusement Park Revenue Model: Where the Money Comes From
Revenue in the amusement park business flows through multiple channels, and understanding their relative weight is essential for accurate financial modeling.
Ticket Sales and Gate Admissions
Gate admissions remain the primary revenue driver, accounting for 55–65% of total income at most parks. Disney Parks’ 2025 fiscal disclosures show admissions at 58% of segment revenue, while Cedar Fair’s publicly filed financials place the figure at 61%. Ticket pricing power depends directly on the perceived quality and variety of your ride portfolio — parks offering a balanced mix of thrill rides, family attractions, and children’s rides command 15–25% higher gate prices than parks with limited ride diversity.
Food, Beverage, and Merchandise Revenue
F&B and retail typically contribute 20–30% of total revenue. IAAPA reports that average per-capita guest spending for mid-size amusement parks reached $52–$62 in 2025, with roughly $18–$24 of that going to food and merchandise. High-margin items like branded souvenirs, funnel cakes, and specialty beverages carry gross margins of 70–85%.
Ancillary Income: Events, Sponsorships, and VIP Experiences
The remaining 5–15% comes from ancillary streams that savvy operators cultivate aggressively:
- Seasonal events — Halloween haunts, holiday light festivals, and summer concert series
- Birthday party and group packages — corporate outings, school field trips
- VIP experiences — fast passes, cabana rentals, behind-the-scenes tours
- Sponsorship deals — ride naming rights, in-park brand activations
These secondary streams often add 8–12% to top-line revenue and carry disproportionately high margins because they leverage existing infrastructure.
Revenue Per Capita Benchmarks by Park Tier
| Metric | Small Park | Mid-Size Park | Large Theme Park |
| Avg. Ticket Price | $15 – $30 | $35 – $60 | $75 – $150+ |
| Per-Capita F&B Spend | $8 – $14 | $16 – $24 | $25 – $45 |
| Per-Capita Total Spend | $25 – $45 | $52 – $80 | $100 – $200+ |


Amusement Park Startup Costs: What It Really Costs to Build an Amusement Park
Startup cost transparency is where most online guides fail investors. Vague ranges like “it costs millions” help no one. Here are the real numbers based on projects I’ve been involved with across multiple markets.
Land Acquisition and Site Preparation
Land costs vary enormously by region. In suburban U.S. markets, expect $500K–$3M for 5–15 acres suitable for a small to mid-size park. In emerging markets across Southeast Asia or Africa, equivalent parcels may cost 60–80% less. Site preparation — grading, drainage, utility connections — adds $200K–$1.5M depending on terrain conditions.
Amusement Attraction and Installation Costs
Amusement equipment typically represents 35–50% of total capital expenditure, making it the single largest controllable cost variable in any park project. A small FEC might invest $300K–$1.2M in rides, while a mid-size park allocates $3M–$15M.
Working directly with an experienced manufacturer like Carnee Rides — which offers turnkey solutions from site planning through installation and after-sales support — can reduce total procurement costs by 15–30% compared to sourcing rides from multiple disconnected vendors. Over twenty-plus years of equipping parks worldwide, we’ve consistently seen that fragmented sourcing inflates costs through duplicated shipping, incompatible infrastructure requirements, and extended project timelines.
Infrastructure, Permits, and Safety Compliance
Beyond rides, budget for:
- Queue systems, POS technology, and ticketing infrastructure: $100K – $500K
- Landscaping, theming, and guest amenities: $200K – $2M
- ASTM F24 safety compliance and engineering certifications: $50K – $300K
- Permitting, environmental impact assessments, and zoning: $30K – $250K
- Insurance premiums: typically 3–6% of projected annual revenue
Cost-to-Build Breakdown by Park Size Tier
| Cost Category | Small Park / FECMid-Size Park | Mid-Size Park | Large Theme Park |
| Land & Site Prep | $200K – $1M | $1M – $5M | $10M – $50M |
| Amusement Equipment | $300K – $1.2M | $3M – $15M | $40M – $200M+ |
| Infrastructure | $100K – $500K | $1M – $5M | $20M – $100M |
| Permits & Compliance | $50K – $200K | $200K – $1M | $2M – $10M |
| Total CAPEX | $500K – $3M | $5M – $30M | $100M – $500M+ |
The global amusement park industry is projected to exceed $78 billion by 2026, according to Statista, which contextualizes these investments within a large and growing market.
Amusement Park Operating Expenses: The Ongoing Costs That Shape Margins
Startup costs get the headlines, but operating expenses determine whether a park actually makes money year after year.
Staffing and Labor Costs
Labor is the single largest operating expense at 30–40% of revenue. A small park with 10–25 seasonal employees faces a fundamentally different cost structure than a large park with 2,000+ staff. Seasonal staffing models — operating 6–8 months per year — reduce annual labor costs but compress the revenue window, requiring higher per-day attendance to hit margin targets.
Ride Maintenance, Inspections, and Equipment Lifespan
Maintenance costs vary dramatically based on equipment quality and manufacturer support. Parks that invest in well-engineered attractions — whether quality carousel rides or roller coasters from reputable suppliers — report 20–35% lower annual maintenance costs versus budget alternatives. This isn’t marketing rhetoric; it’s a pattern I’ve observed across hundreds of installations over two decades.
Quality amusement ride lasts 15–30 years with proper preventive maintenance. Budget equipment often requires major refurbishment or replacement within 8–12 years, dramatically altering total cost of ownership calculations.
Insurance, Utilities, and Seasonal Overhead
| OPEX Category | % of Annual Revenue |
| Labor | 30% – 40% |
| Ride Maintenance | 8% – 12% |
| Marketing | 5% – 10% |
| Utilities | 4% – 7% |
| Insurance | 3% – 6% |

OPEX as a Percentage of Revenue: Industry Benchmarks
The formula every park investor should internalize:
Net Operating Margin = (Total Revenue – OPEX – Depreciation – Debt Service) ÷ Total Revenue
For a mid-size park generating $10M in annual revenue with $7.2M in total operating costs (including depreciation and debt service), that yields a 28% gross operating margin and roughly 18% net margin after all obligations. The operators who consistently outperform this benchmark share one trait: they control equipment costs on both the CAPEX and OPEX side through strategic supplier relationships.
How Long Does It Take for an Amusement Park to Break Even?
Break-Even Timeline by Investment Size
Break-even timelines follow predictable patterns:
- Small parks ($500K–$3M investment): 2–4 years
- Mid-size parks ($5M–$30M investment): 4–7 years
- Large theme parks ($100M+ investment): 7–12+ years
Factors That Accelerate (or Delay) Your Break-Even Point
Five factors exert the most influence on break-even speed:
- Initial CAPEX efficiency — Overspending on infrastructure while under-investing in revenue-generating rides is the most common mistake
- Attendance ramp-up curve — First-year attendance typically reaches 60–75% of stabilized levels; marketing strategy during year one is critical
- Per-capita spending optimization — Dynamic pricing and strong F&B operations accelerate cash flow
- Operating cost discipline — Keeping OPEX below 75% of revenue in the early years
- Debt structure — Parks financed with 40–50% equity and favorable loan terms break even 1–2 years faster than heavily leveraged projects
Calculating Your Break-Even Point: A Step-by-Step Framework
Here’s the simplified calculation:
Break-Even Attendance = Fixed Annual Costs ÷ (Revenue Per Visitor – Variable Cost Per Visitor)
For example, a mid-size amusement park with $2.5M in fixed annual costs, $55 revenue per visitor, and $22 variable cost per visitor needs approximately 75,760 visitors annually to break even. Every visitor beyond that threshold contributes directly to profit.
Strategic equipment selection from a manufacturer offering complete theme park planning services reduces upfront overinvestment and shortens the payback period. In one Southeast Asian project we supported, turnkey delivery cut pre-opening costs by 18% compared to the client’s original multi-vendor procurement plan.


What Rides Generate the Most Revenue for Amusement Parks?
High-Throughput Rides vs. High-Thrill Attractions: Revenue Comparison
Not all rides contribute equally to the bottom line. The framework I use evaluates each attraction across five dimensions: purchase cost, hourly throughput capacity, maintenance burden, expected lifespan, and demographic appeal.
Equipment Cost-to-Revenue Generation Framework
| Ride Type | Avg. Cost | Hourly Capacity | Annual Maintenance | Lifespan | 10-Year ROI |
| Bumper Cars | $40K – $120K | 120 – 200 riders | $3K – $6K | 15 – 20 yrs | Very High |
| Carousel | $60K – $250K | 150 – 300 riders | $4K – $8K | 20 – 30 yrs | High |
| Ferris Wheel | $150K – $800K | 100 – 250 riders | $6K – $15K | 20 – 30 yrs | High |
| Roller Coaster | $500K – $20M+ | 500 – 1,800 riders | $30K – $150K | 20 – 30 yrs | Moderate-High |
| Kiddie Rides | $10K – $80K | 60 – 150 riders | $1K – $4K | 12 – 20 yrs | Very High |
| Drop Tower | $200K – $2M | 200 – 500 riders | $10K – $30K | 18 – 25 yrs | High |
Best Ride Mix Strategy for Maximum Profitability
The optimal ride mix for parks targeting the broadest demographic and highest per-visit spending is approximately 30% thrill attractions, 40% family rides, and 30% kiddie rides. This ratio maximizes dwell time — families stay longer when every age group has options — and drives ancillary spending. A parent watching their child on a kiddie ride is a parent buying snacks, drinks, and souvenirs.
Bumper cars, drop towers, and Ferris wheels consistently rank among the highest-ROI attractions due to low maintenance requirements and high repeat ridership within a single visit.

Regional Profitability: Where Are Amusement Parks Most Profitable in 2026?
North America and Europe: Mature Markets with Premium Pricing
North American parks benefit from high per-capita spending ($50–$70 average) and sophisticated revenue management practices. European parks leverage strong seasonal tourism flows, particularly in Mediterranean and Northern European resort areas. Net margins in both regions typically land at 15–25% for well-operated parks, though market saturation means new entrants face intense competition for attendance.
Southeast Asia, the Middle East, and Africa: Emerging Markets with High Growth
The most compelling profitability story in 2026 is happening outside traditional Western markets. Southeast Asia and the Middle East offer a powerful combination: lower startup costs (land and labor), rapidly expanding middle-class populations, and year-round operating seasons that eliminate the seasonal revenue compression plaguing northern-latitude parks.
Well-positioned parks in these regions achieve 20–30% net margins. Statista projects Asia-Pacific amusement park revenue growth at 8–11% annually through 2028.
Africa remains significantly underserved, presenting first-mover advantages for investors willing to navigate developing infrastructure. Carnee Rides has supported park projects across multiple emerging regions with customized ride packages designed for local market conditions, budget parameters, and climate considerations.
Regional Comparison Table
| Region | Avg. Startup Cost | Operating Season | Per-Capita Spend | Typical Net Margin | Growth Rate |
| North America | High | 6 – 12 months | $50 – $70 | 15% – 25% | 3% – 5% |
| Europe | High | 5 – 10 months | $45 – $65 | 15% – 22% | 3% – 4% |
| Southeast Asia | Low – Medium | Year-round | $15 – $35 | 20% – 30% | 8% – 11% |
| Middle East | Medium – High | Year-round (indoor/outdoor) | $30 – $55 | 18% – 28% | 7% – 10% |
| Africa | Low | Year-round | $8 – $20 | 15% – 25% | 10% – 15% |
Case Study: How Small to Mid-Size Parks Achieve Profitability in 3–5 Years
Case Study 1: A Family Entertainment Center With $1.2M Investment
A family entertainment center in a mid-tier Southeast Asian city invested $1.2M total: $480K in amusement ride (12 attractions sourced through a single manufacturer for cost efficiency), $320K in site preparation and infrastructure, and $400K in working capital and pre-opening expenses.
By year three, the park generated $680K in annual revenue with a 14% net margin — roughly $95K in annual profit. The operator credited single-source procurement with saving approximately $140K compared to initial multi-vendor quotes, and the streamlined installation timeline allowed the park to open six weeks ahead of schedule, capturing an additional peak-season revenue window.
Case Study 2: A Regional Theme Park in an Emerging Market
A mid-size amusement park in Southeast Asia required $8M in total investment across 25+ attractions, including water rides and thrill rides. The park achieved break-even at 4.2 years and now operates at a 22% net margin with 400,000 annual visitors. Year-round tropical climate eliminated seasonal revenue gaps, and a strong F&B program contributes 28% of total revenue.
Key Lessons From Profitable Park Operators
- Single-source equipment procurement reduces costs and project timeline risk
- Phased ride additions (1–2 new attractions every 2–3 years) sustain visitor interest and spread CAPEX
- Strong F&B strategy adds 25%+ to revenue at high margins
- Data-driven dynamic pricing lifts per-capita spending by 10–18%
- Preventive maintenance extends ride lifespan and reduces costly unplanned downtime

How to Maximize Amusement Park Profitability: 8 Proven Strategies
- Partner with a turnkey ride manufacturer who handles everything from site planning through installation. Companies like Carnee Rides offer end-to-end amusement park solutions — from concept design to after-sales support — reducing project management overhead and timeline risk significantly.
- Implement dynamic ticket pricing based on demand patterns. Six Flags reported 12–18% gate revenue increases after adopting demand-based pricing models in 2024–2025.
- Launch season pass programs that generate upfront cash flow and increase per-visit F&B and merchandise spending by 25–40%.
- Add event-based revenue streams — Halloween events, holiday festivals, and concert series yield 8–15% revenue uplift during shoulder seasons when base attendance dips.
- Invest in ride customization and theming to differentiate your park. Custom-designed signature attractions command premium pricing and generate social media buzz that reduces marketing costs.
- Establish preventive maintenance programs that reduce unplanned downtime by up to 40% and extend ride lifespan by 5–10 years beyond baseline expectations.
- Deploy data analytics for guest flow optimization and labor scheduling efficiency — even basic attendance forecasting models improve labor cost management by 8–12%.
- Phase expansion strategically — adding 1–2 new attractions every 2–3 years sustains repeat visitation growth and gives you annual marketing hooks without requiring massive one-time capital outlays.
Is Owning an Amusement Park Profitable in 2026? Final Verdict
Who Should Invest in an Amusement Park
Amusement parks are profitable when built with disciplined financial planning, intelligent equipment sourcing, and diversified revenue strategies. Net margins of 10–25% are achievable across all park tiers, and the global industry’s growth trajectory — projected to exceed $85 billion by 2028 according to Statista — provides strong tailwinds.
Ideal investor profiles include entrepreneurs with $500K–$5M in available capital for small parks, institutional investors and hospitality groups for large-scale projects, and existing entertainment operators looking to expand their portfolio into physical attractions.
Risk Factors and Realistic Expectations
Honest risk assessment matters. Seasonality compresses revenue windows for parks outside tropical climates. Weather dependency means a rainy summer can cut attendance by 15–25%. Economic downturns reduce discretionary entertainment spending. Insurance costs continue rising at 4–7% annually. Regulatory requirements vary dramatically by jurisdiction and can delay opening timelines by 6–18 months.
None of these risks is disqualifying — they’re manageable with proper planning and adequate capital reserves.
Your Next Steps: From Research to Revenue
The path from research to operating park follows a clear sequence: develop a feasibility study grounded in local market demographics, secure financing with realistic attendance projections, partner with an experienced amusement park ride manufacturer, and build your operations team at least six months before opening day.
The amusement park business rewards operators who think in decades, not quarters. The parks generating 20%+ margins today made smart equipment and design decisions five, ten, or fifteen years ago — and they’re still benefiting from those choices every single operating day.


